Dashboard
Click the button below to access the files containing the Interactive Power BI dashboard file, excel sheet, SQL scripts and more. Scroll to learn of the interactive functionalities of the dashboard and how it meets the business request demands.
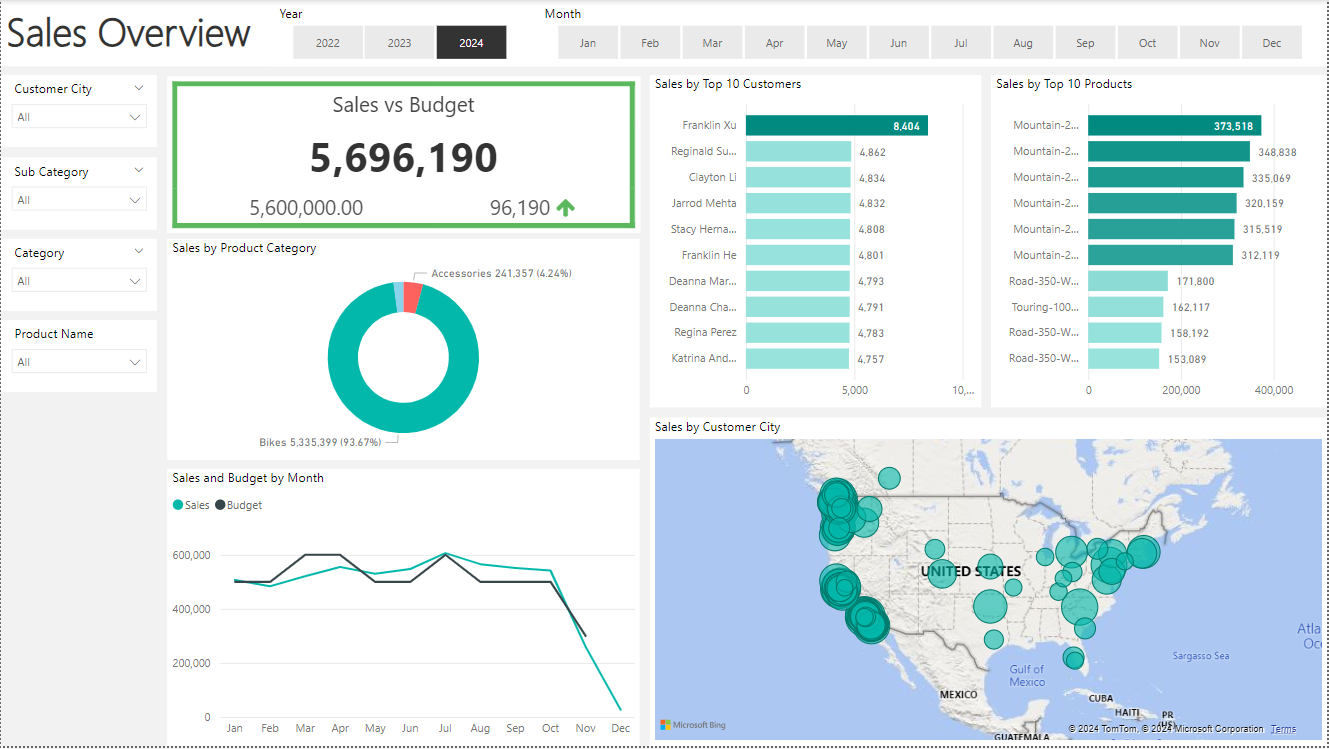
The Sales Overview page provides a comprehensive view of online sales performance, comparing actual sales against the budget. This page features several key performance indicators (KPIs), trend graphs, and a geographical sales distribution map focused on the United States.
Functionalities:
KPI Tile: Displays total sales and budget values, allowing users to quickly gauge overall performance.
Trend Graphs: Shows sales and budget trends over time, highlighting any discrepancies or achievements against the budget.
Geographical Map: Visualizes sales by customer city, providing insights into regional performance and identifying high-performing areas.
Interactive Filters: Users can filter data by year, month, customer city, subcategory, category, and product name.
Sales Manager: The Sales Overview page gives a high-level view of online sales, allowing managers to follow which customers and products sell the best. The data updates daily to ensure real-time insights.
Sales Manager: The inclusion of budget comparisons allows managers to monitor sales performance over time and assess how well the team is meeting its financial goals.
User Story Fufillment:
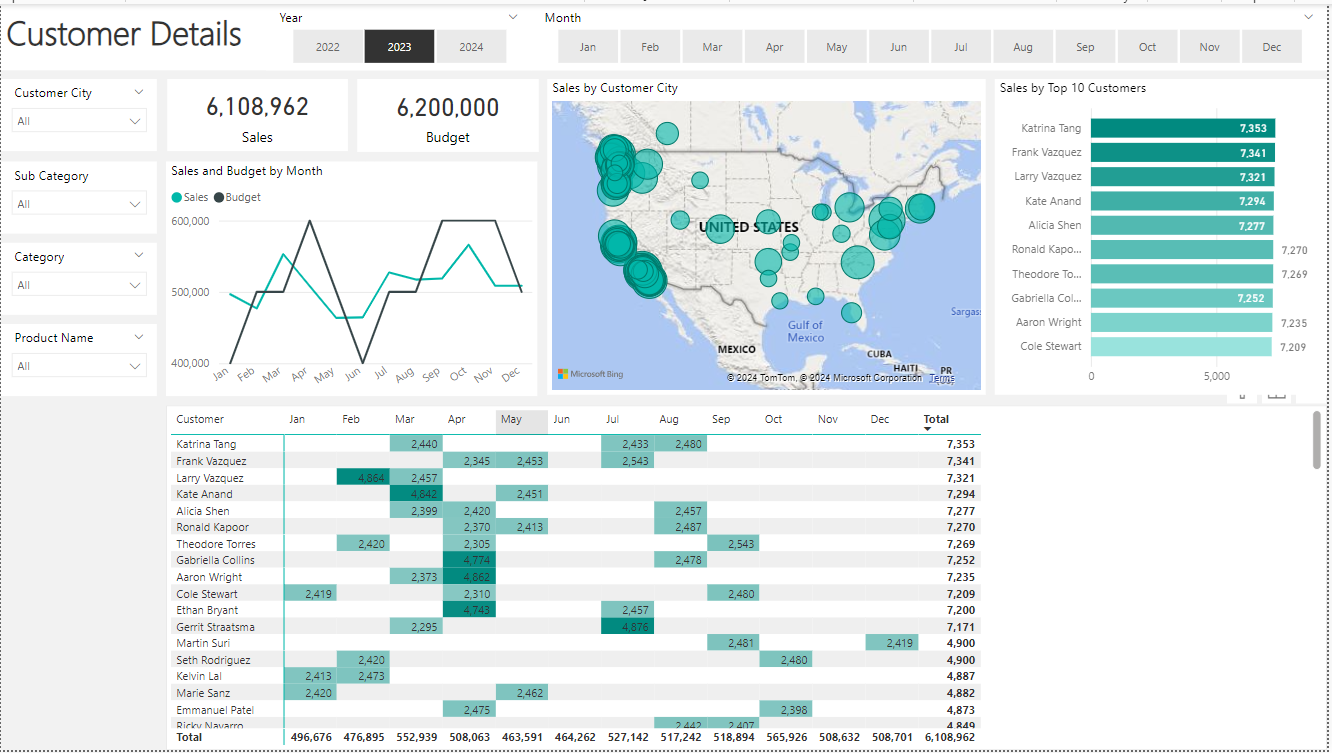
The Customer Details page focuses on sales performance per customer, enabling sales representatives to track customer-specific data. It includes detailed sales figures, a top customers list, and monthly sales breakdowns.
Functionalities:
Sales Table: Detailed breakdown of sales by customer, month by month, providing granular insights into purchasing patterns.
Top Customers Chart: Highlights the top 10 customers based on sales, enabling sales reps to identify key accounts.
Interactive Filters: Users can filter data by year, month, customer city, subcategory, category, and product name.
Sales Representative: This page offers an overview of online sales per customer, allowing representatives to follow up with customers who buy the most and identify opportunities for upselling.
Sales Manager: Managers can also use this page to monitor customer-specific sales trends and performance, ensuring that strategic accounts are well managed.
User Story Fufillment:
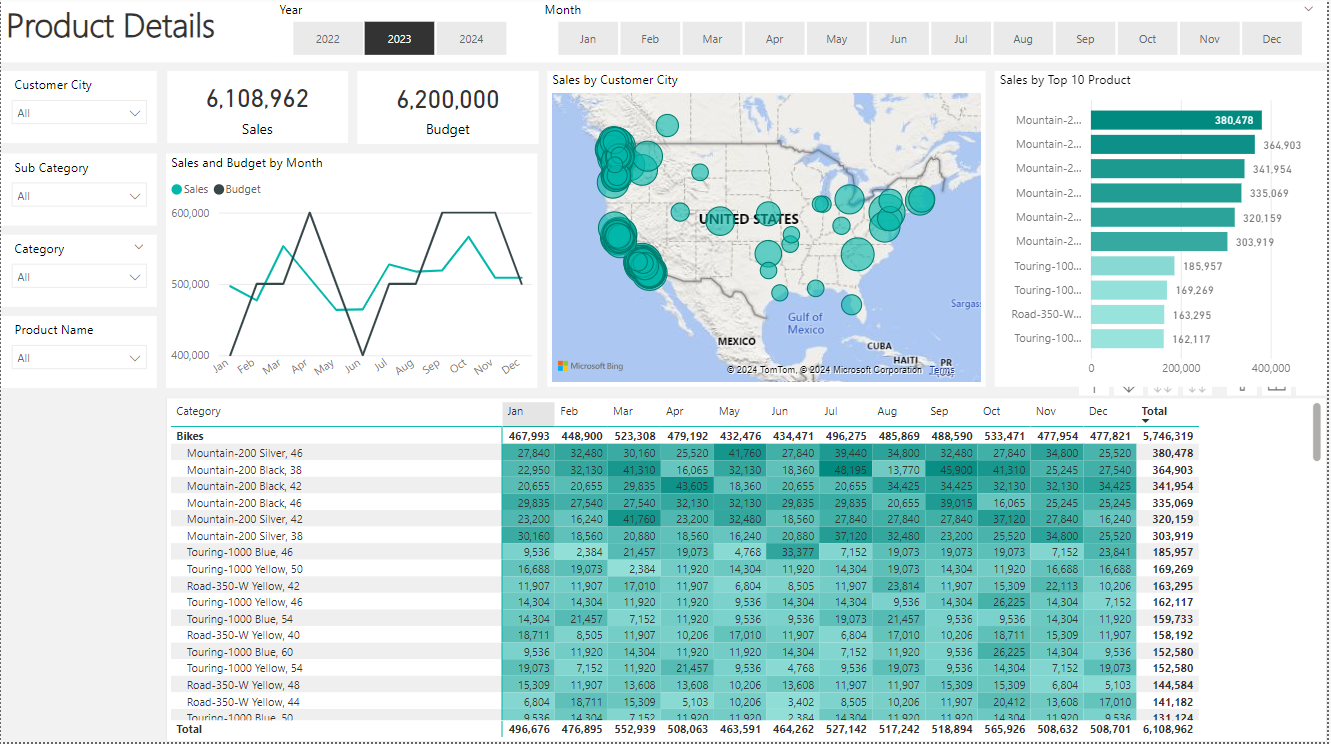
The Product Details page emphasizes product-specific sales performance, helping sales representatives understand which products are performing well. It includes detailed sales figures, a top products list, and monthly sales breakdowns.
Functionalities:
Sales Table: Detailed breakdown of sales by product, month by month, showing how each product is performing over time.
Top Products Chart: Highlights the top-selling products, enabling reps to focus on high-demand items.
Interactive Filters: Users can filter data by year, month, customer city, subcategory, category, and product name.
Sales Representative: This page provides an overview of online sales per product, helping representatives to focus on the products that sell the most and identify potential areas for growth.
Sales Manager: Managers can track product-specific sales trends, ensuring that product strategies align with market demand and company goals.
User Story Fufillment:
Overall, the Power BI dashboard effectively addresses the needs of both sales managers and representatives by providing interactive, real-time data visualizations and comprehensive filtering options. This enables informed decision-making and strategic planning, enhancing overall sales performance.
- © Untitled
- Design: HTML5 UP