Sales Management Analysis Project
Business Request & User Stories
The buisness request for this project is of a sales report for sales managers and sales representstives. Based on the request made, I defined the following user stories to ensure that the criteria's were maintained throughout the project.
| No # | Role | I want (request/ demnad) | So that I (user value) | Acceptance Criteria |
|---|---|---|---|---|
| 1 | Sales Manager | To get a dashboard overview of online sales | Can follow better which customers and products sell the best | A power BI dashboard which updates data once a day |
| 2 | Sales Representative | An overview of internet sales per customer | Can follow up customers that buy the most and who we can sell more to | A Power BI dashboard which allows me to filter data for each customer |
| 3 | Sales Representative | An overview of online sales per Products | Can follow up on the product that sells the most | A Power BI dashboard which allows me to filter data for each product |
| 4 | Sales Manager | A dashboard overview of online sales | Follow sales over time against budget | A Power BI dashboard with graphs and KPIs comparing against budget |
Data Cleansing & Transformation (SQL)
To develop the required data models for analysis and to meet the business needs outlined in the user stories, the following tables were extracted using SQL.
The sales budget data, provided in an Excel format, was later integrated into the data model. (I created the sales budget realistically by analyzing the annual sales trends).
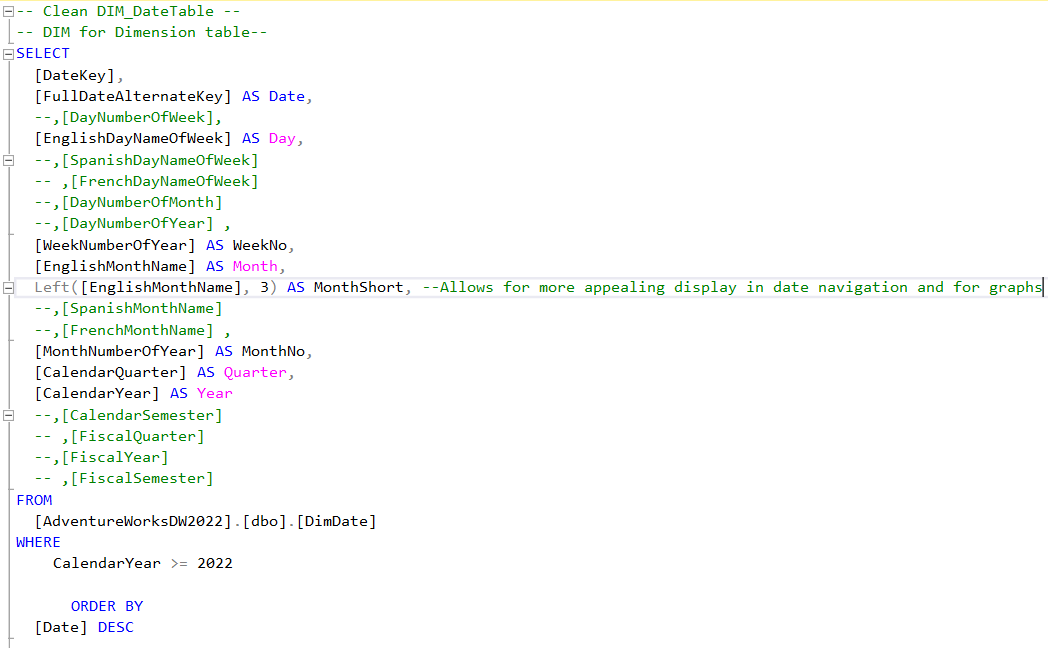
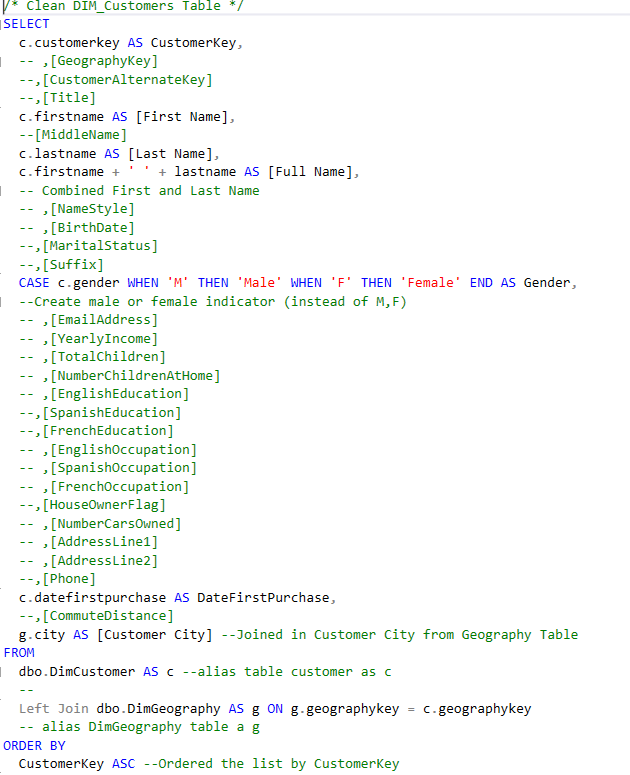
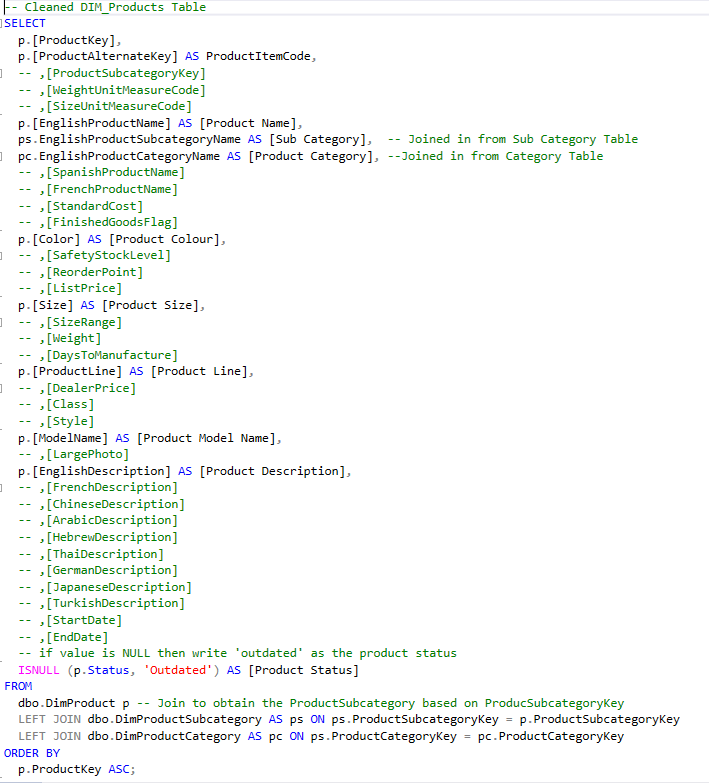
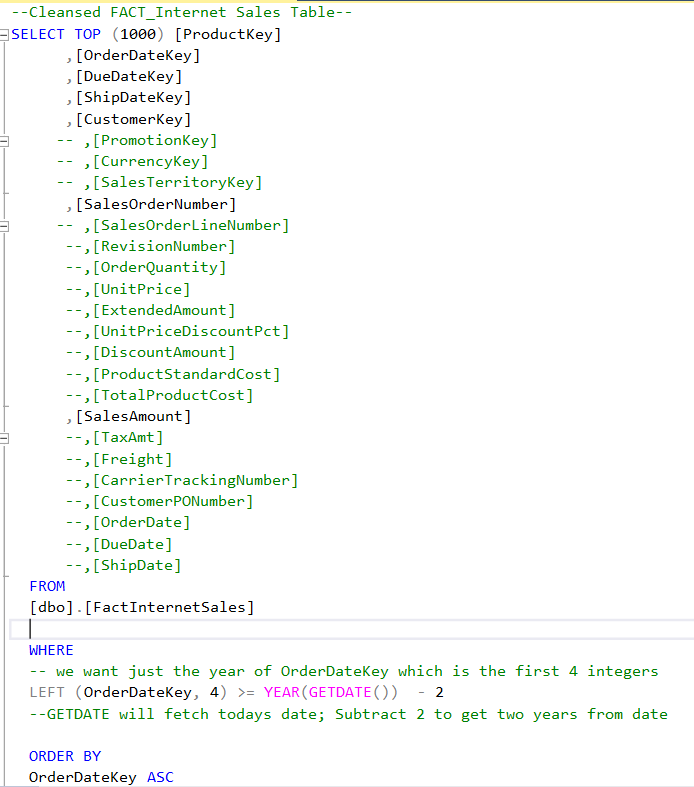
The SQL statements below were used for cleansing and transforming the necessary data.
Dim_Calendar:
Dim_Customers:
Dim_Products:
FACT_InternetSales:
Data Model
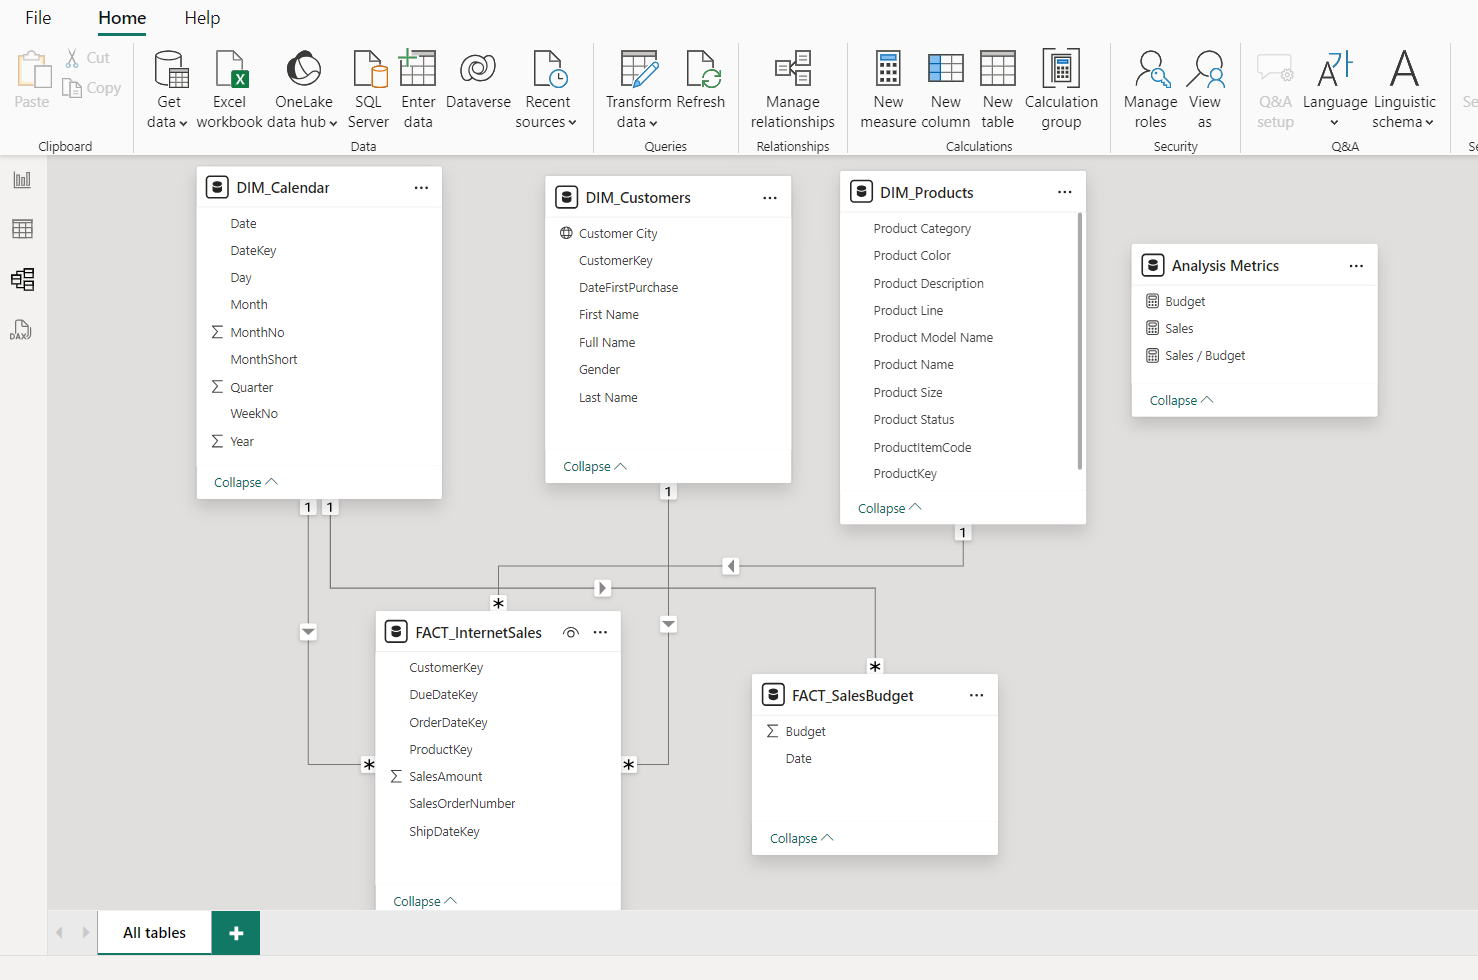
Below is a screenshot of the data model after the cleansed and prepared tables were imported into Power BI.
This data model also demonstrates how FACT_SalesBudget is linked to FACT_InternetSales and other relevant dimension tables and their foreign keys.
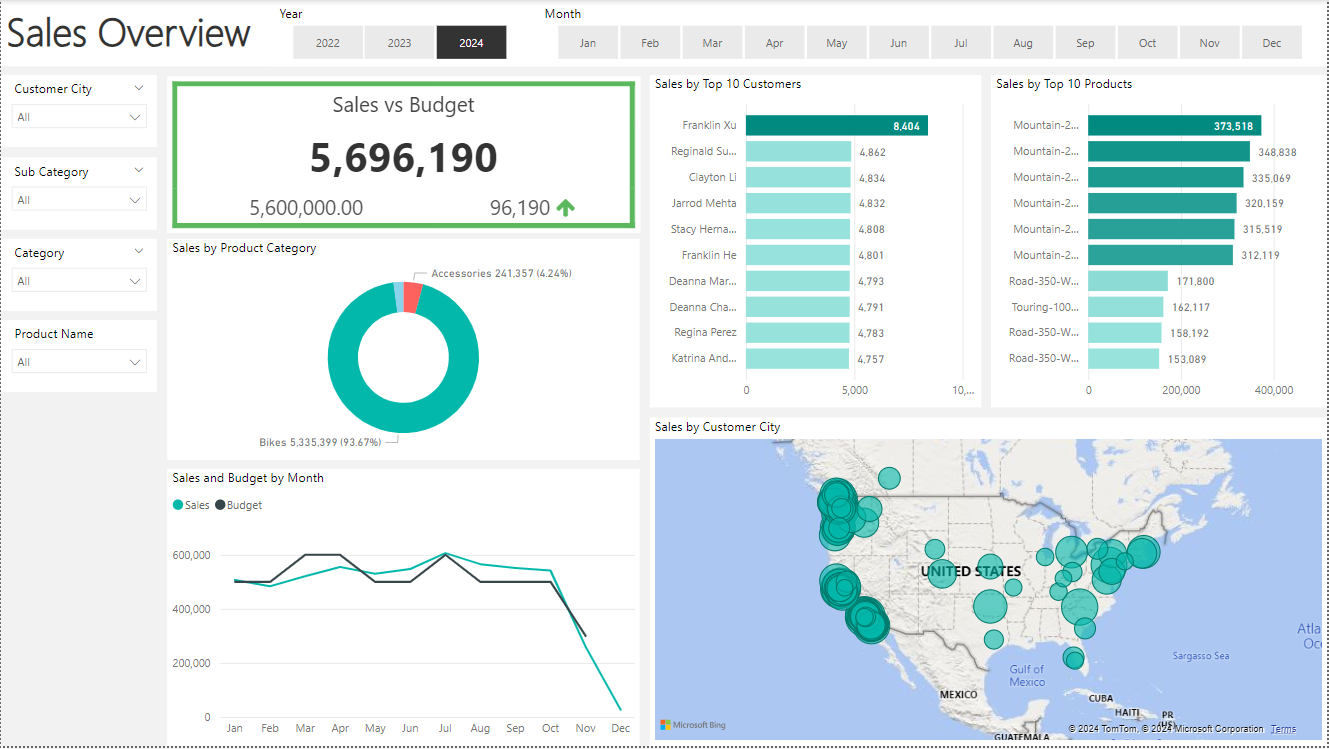
Sales Management Dashboard
The completed Sales Report dashboard includes three pages, each featuring three interactive visualizations. Page 1 presents a Sales Overview, Page 2 focuses on Customer Details, and Page 3 provides Product Details.
Click the repository button below to access the Power BI dashboard files and try it out. Click the image to view dashboard screenshots and description of key functionalities in the dashboard used to suffice the user story request!